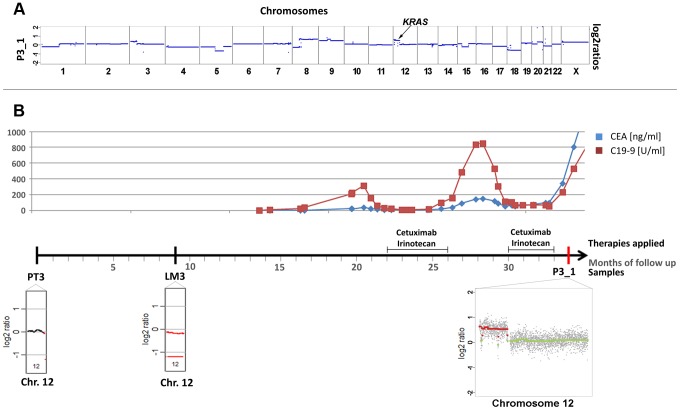
Figure 3. Occurrence of a chromosomal 12p polysomy under cetuximab therapy in patient #26C1.
(a) Plasma-Seq (P3_1) confirmed the vast majority of the copy number changes observed in the two pre-treatment samples PT3 and LM3 (Complete array-CGH profiles of these two pre-treatment samples are shown in Figure S3). In plasma-Seq the high-level gain of the entire chromosome 12p including the KRAS gene was a novel change. (b) Time line indicating the timing of two cycles of cetuximab and CEA (ng/ml) and CA 19-9 (U/ml) (in blue and red, respectively) levels. Below the time line are chromosome 12 plots made by array-CGH [from the primary tumor (PT3), month 0; and a liver metastasis (LM3), month 9; black: balanced regions; red: lost regions] or by plasma-Seq (P3_1, month 35; color designation as in Figure 1).

