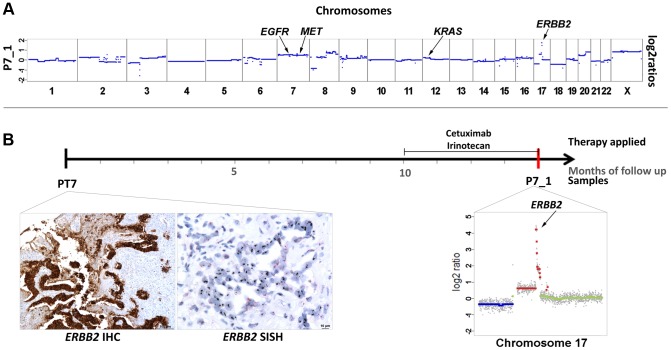
Figure 6. High-level focal amplification of ERBB2 in patient #7 treated with cetuximab.
(a) Copy number profile of the plasma sample (P7_1) and the locations of the EGFR, MET, KRAS, and ERBB2 genes. (b) The time line illustrates the duration of cetuximab treatment and the date (red bar) of our blood collection. Below the time line are the ERBB2 immunohistochemistry and silver in situ hybridization (SISH) images of the biopsy material from the primary tumor (month 0) showing an immunoreactive score 3+ and high amplification, respectively. Her2/neu signals are black in the SISH technique. Furthermore, a plot of chromosome 17 from P7_1 obtained at month 14 is illustrated (note that the scale of the Y-axis reaches till 5 to illustrate the high-level gain; color designation as in Figure 1).

