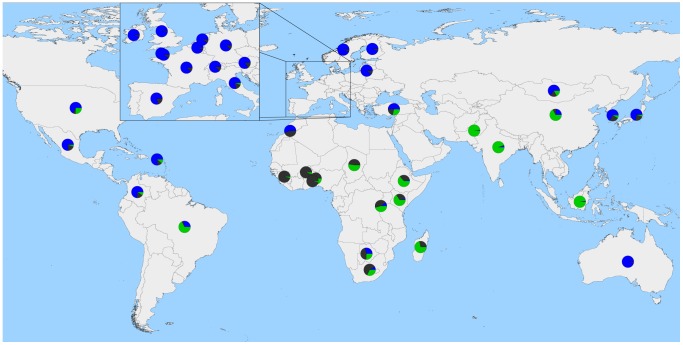
Figure 5. Worldwide map with country averages of ancestry proportions with 3 ancestral populations (K = 3).
Blue represents Eurasian Bos t. taurus ancestry, green represents Bos javanicus and Bos t. indicus ancestry, and dark grey represents African Bos. t. taurus ancestry. Please note, averages do not represent the entire populations of each country, as we do not have a geographically random sample.

