
Figure 4.
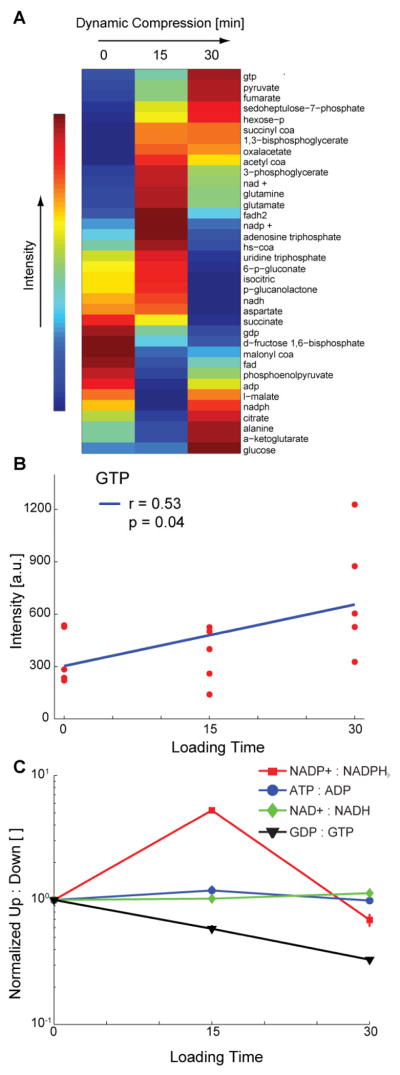
Changes in expression of targeted central-energy-related metabolites over from 0–30 minutes of applied compression. Metabolites associated with central energy metabolism and protein production (e.g. amino acids) were targeted for detailed analysis via detection of multiple ionized adducts and ions. (A) Clustered heatmap of co-expressed metabolites. (B) Significant accumulation (correlation) of GTP and marginally-significant depletion of GDP in response to applied compression. (C) Ratios of upstream to downstream mediators of central energy metabolism. The peak in NADP+ to NADPH indicates decreased energy flow toward the pentose phosphate pathway, and the continual decrease in GDP to GPT indicates increased flux through the TCA cycle.