FIGURE 1:
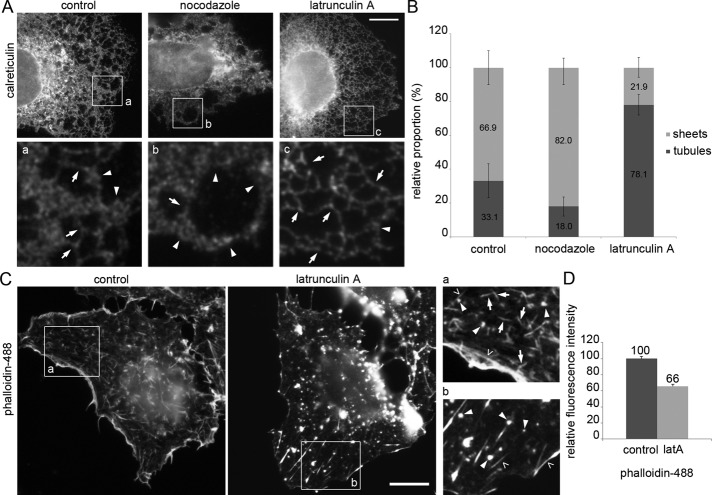
Actin and MT depolymerization have opposite effects on the ER sheet–tubule ratio in Huh-7 cells. (A) Wide-field image of fixed control and nocodazole- and latrunculin A–treated cells immunolabeled for calreticulin. Magnifications from the boxed areas (a and b) were Gaussian filtered. Tubules (arrows) and abundant sheets (arrowheads) are indicated. See also Supplemental Figures S1A and 2A. (B) Images were quantified by the intersection method, and results are expressed as relative proportions (percentage) of sheets and tubules. Error bars, ±SD. (C) Wide-field images and (D) relative fluorescence intensity measurements of fixed control and latrunculin A–treated cells stained with phalloidin. Long actin filaments (open arrowheads), filament arrays <5 μm (arrows) and foci (arrowheads) are shown with higher magnification in boxed regions (insets a and b). Error bars, ±SEM. See also Supplemental Figures S1, B and C, and S2, C and D. Bars, 10 μm.

