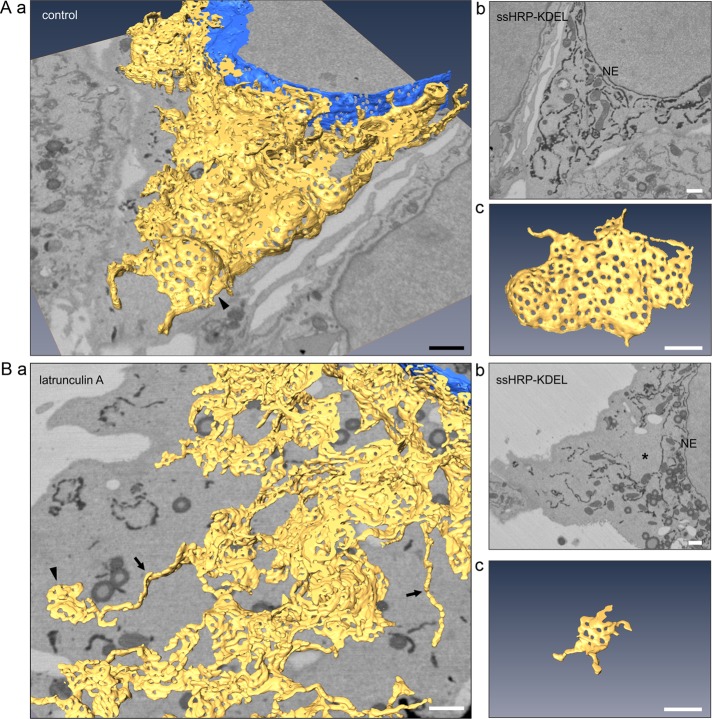
FIGURE 2:
Actin depolymerization–induced sheet remnants and uneven ER network distribution are revealed by 3D EM. (A) Control and (B) latrunculin A–treated Huh-7 cells transiently expressing ssHRP-KDEL were chemically fixed, cytochemically stained (dark precipitate), and imaged with SB-EM. (a) Model of the ER network (yellow) and the nuclear envelope (NE; blue), (b) one block face image; (c) a representative fenestrated sheet. Asterisk, area void of ER within unevenly distributed ER network; arrowheads, sheets; arrows, tubules. See Supplemental Videos S1 and S2 for the SB-EM data set and models. Bars, 1 μm (in perspective view [a] apply to center of image).

