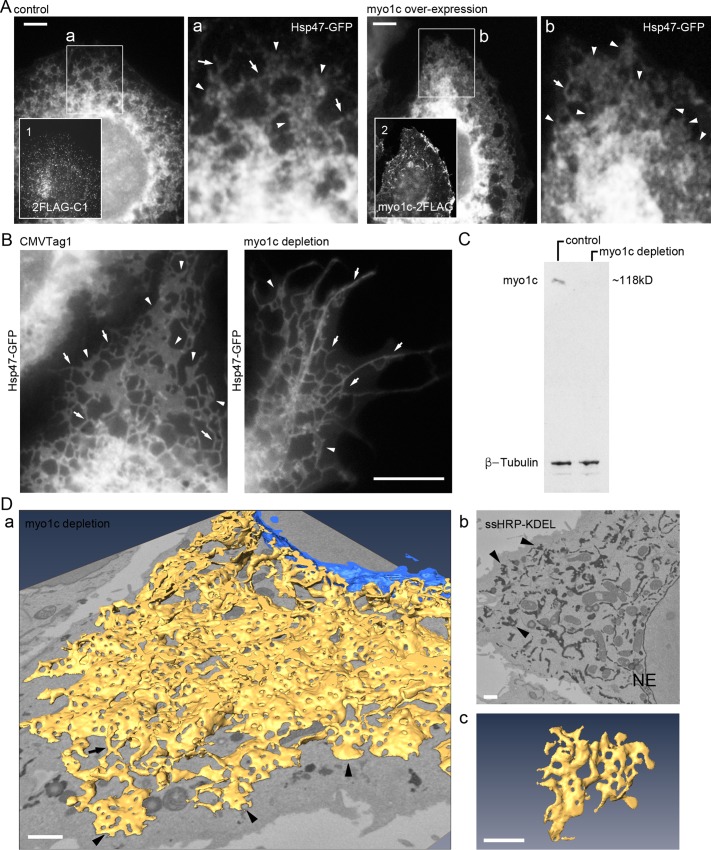
FIGURE 6:
Myo1c manipulations lead to loss of sheets and ER network distribution deficiency in Huh-7 cells. (A) Wide-field image of myo1c overexpression–induced ER phenotype in fixed cell coexpressing Hsp47-GFP and 2FLAG-C1 (control) or myo1c-2FLAG (myo1c overexpression) and immunolabeled with anti-FLAG antibody (insets 1 and 2). Boxed areas (a and b) are shown at higher magnification. Sheets/interlinked sheet mass (arrowhead) and tubules (arrows) are indicated. See also Supplemental Figure S2F. (B) Live wide-field images of control (CMVTag1) or myo1c-depleted (shRNA) cells expressing Hsp47-GFP. ER tubules (arrows) and sheets (arrowheads) are indicated. See Supplemental Figures S2G and S6A for comparison. (C) Cells transfected with CMVTag1 (control) or pooled myo1c shRNAs (myo1c depletion) were analyzed by Western blotting with the indicated antibodies. See also Supplemental Figure S6B. (D) A cell coexpressing ssHRP-KDEL and pooled myo1c shRNAs was cytochemically stained (dark precipitate) and imaged with SB-EM (see Supplemental Video S7 for SB-EM data set and model). (a) Model of ER network (yellow) and NE (blue); (b) one block face image; (c) a representative sheet remnant. Sheet remnants (arrowheads) and tubules (arrow) are indicated. See Figure 2, A and B, for comparison. Bars, 5 μm (A), 10 μm (B), and 1 μm (D; in the perspective view [a] apply to center of image).

