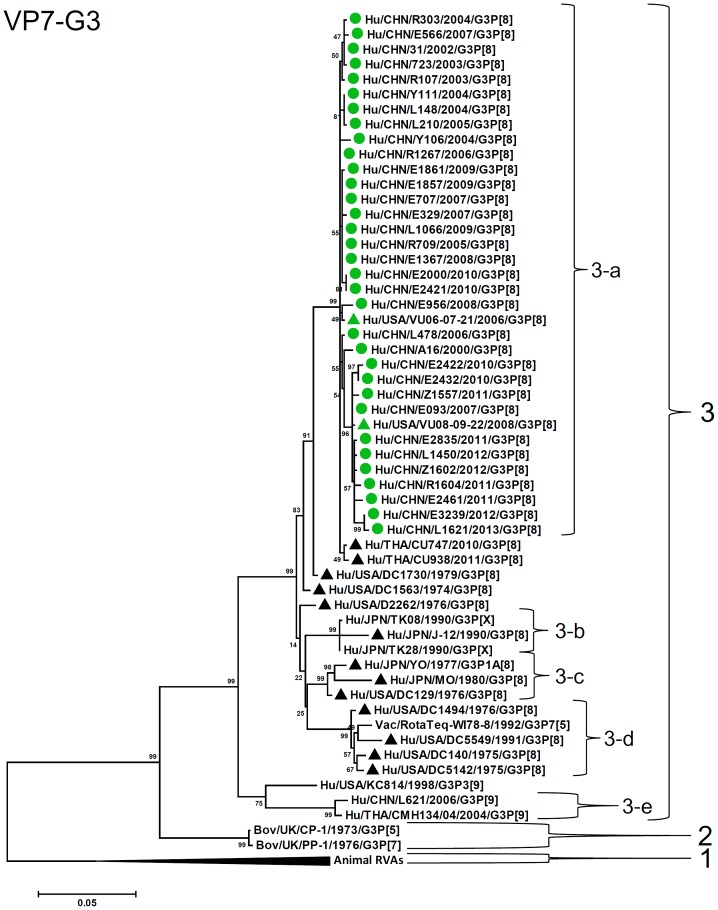
Figure 3. Phylogenetic dendrogram constructed from VP7 gene with genotypes G3.
Lineages and sublineages within a genotype were assigned arbitrarily based on observation of clustering patterns, and shown on the right. G3P[8] strains analyzed in the present study are marked with circle, while G1P[8] strains in Wuhan, China [48], with square, and G3P[8] strains in the US reported previously [19], [37] and G3P[8] strain YO with triangle. Lineages (sublineages) of above strains are discriminated by colors of the marks, i.e., green (main lineage), orange, red, pink, blue, or gray. Black triangles indicate strains outside above lineages. Colors of lineages in each RNA segment correspond to those shown in Fig. 15. Scale bars are shown below. Bootstrap values are indicated at nodes of branches.

