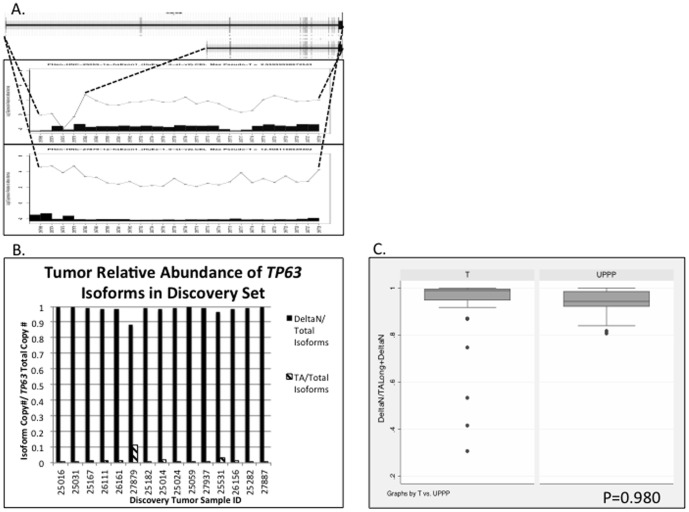
Figure 3. Splice variants of TP63 demonstrated in exon array analysis (A) and quantitative RT-PCR validation (B and C).
A, Example of discovery HNSCC primary tumor samples predicted to have dominant expression of TAp63 (long) and DeltaNp63 (short) isoforms, respectively. Uppermost box displays all exons for long and short isoforms of TP63. Middle and lower boxes display exon-specific array probesets along horizontal axis, and probeset signal relative to normal (0) on the vertical axis, log2 scale. For each probeset, the inset histograms display the number of standard deviations from the mean probeset signal in UPPP samples, that the probeset signal deviates in each individual tumor. B, Splice index calculations [Absolute Copy # of TP63 isoform / (TAp63+ DeltaNp63)] in 15 discovery tumor samples. C, Comparison of mean splicing index for TP63 isoforms in an independent validation set of 47 HNSCC tumors vs. 19 UPPP samples, two-tailed Student’s t test, P = 0.980.

