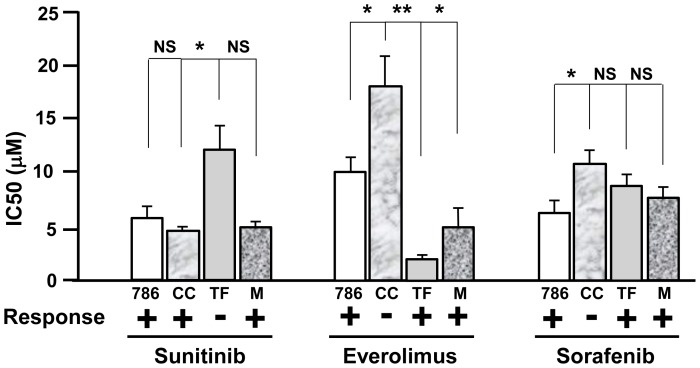
Figure 2. In vitro sensitivity of the TF, CC and M cells to targeted therapies.
The IC50 of the different drugs was determined using the MTT test with concentrations of the drugs ranging from 0.1 µM to 100 µM in 786-O (786), TF, CC and M cells. The means SEMs and p-values (Student t test), in comparison with the IC50 for 786-O cells, the reference value, are shown. *p<0.05; **p<0.01 (Student t test).

