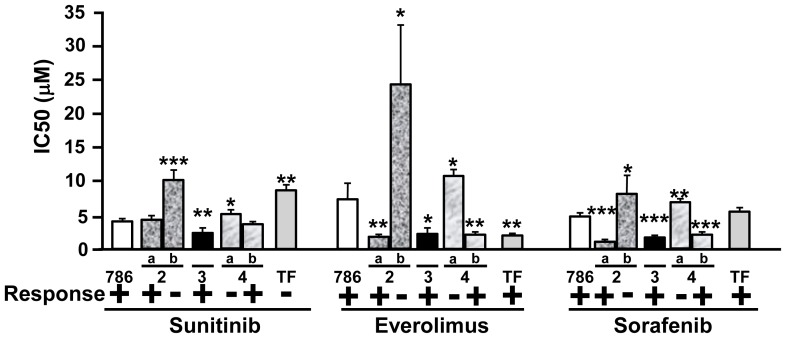
Figure 4. In vitro sensitivity of cells isolated from different patients with ccRCC to targeted therapies.
Cells were isolated from ccRCC of different Fuhrman grades (two grade 2 tumors (a, b), one grade 3 and two grade 4 (a, b). The IC50 of the different drugs was determined using the MTT test with concentrations of the drugs raning from 0.1 µM to 100 µM and the results were compared with the IC50 in 786-O (786) and TF cells. The expected response of the patients to the different drugs is indicated (− non-responder, + responder). The means, SEMs and p values (Student t test), in comparison with the IC50 for 786-O cells, the reference value, are shown. *p<0.05; **p<0.01; ***p<0.0001.

