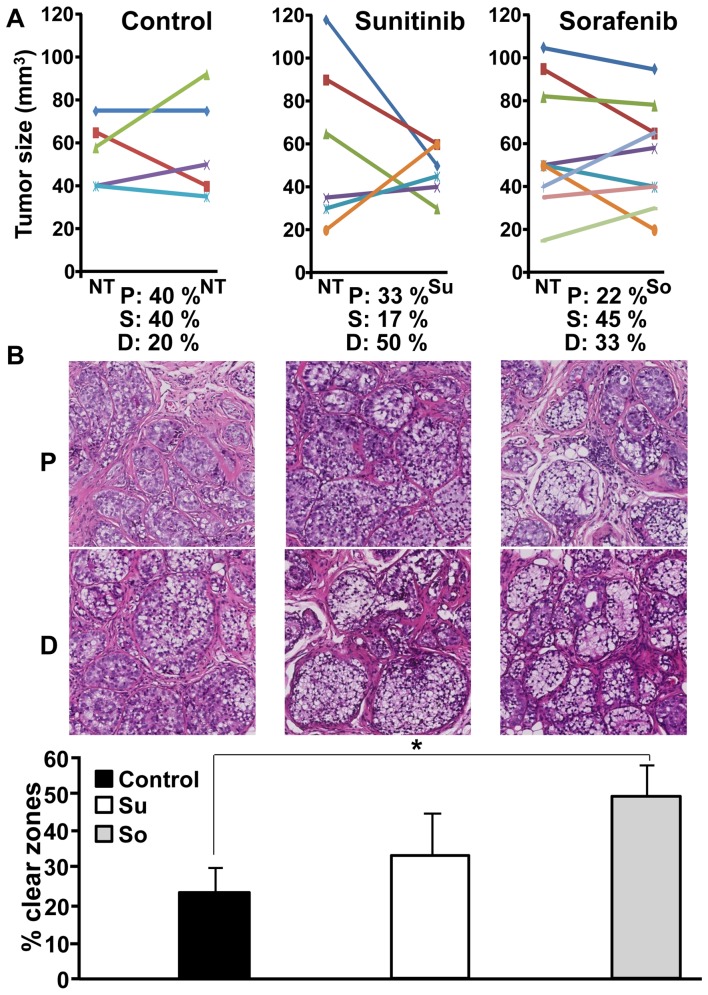
Figure 5. In vivo sensitivity of the TF cells to the different drugs used to treat the patient.
A) 107 cells were subcutaneously injected into nude mice. When the tumor was visible mice were treated with sunitinib or sorafenib for 15 days. Tumor size was evaluated with a caliper. The percentage of mice with progression (P), decrease (D) or stabilization (S) of the tumor size is indicated. B) The general histological aspect of a progressing tumor (P) or a regressing (D) tumor is shown for the different situations (Control, sunitinib, sorafenib). The percentage of clear zones in stable or responsive tumors was evaluated using the Leica software SlidePath Gateway. Statistical analysis was performed using a student's t test (* p<0.05).

