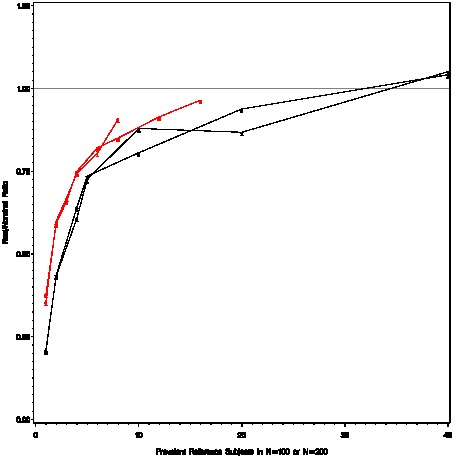
Figure 2. Factors controlling the departure of real and nominal weights.

The red curves correspond to a prevalence ratio of 10, and the black curves correspond to a prevalence ratio of 2. For each fixed prevalence ratio, two sample sizes  (plotting symbol = 1) and
  (plotting symbol = 2) are shown. For a fixed prevalence ratio and sample size, one can vary the number of positives in class 0 (C0), and compute the corresponding number of positives in class 1 (C1). The x-axis is C0. One can then compute the nominal and real weights from C0, C1, N0, and N1. The primary determinate for departures between the real and nominal weights appears to be the number of positives in the sample (x-axis), and not the total sample size (1 versus 2 plotting symbol). The apparent prevalence ratio (red versus black) appears to play a minor secondary role.
