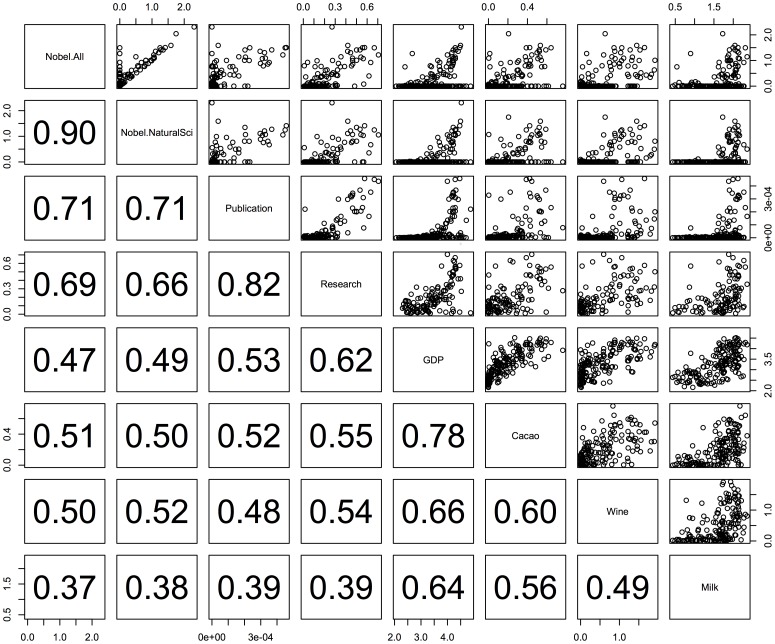
Figure 1. Relations between the numbers of Nobel laureates per 10 million people and the explanatory factors.
The relations are given for all Nobel categories (“Nobel.All”) and for natural sciences' Nobel laureates (Nobel.NatSci). The factors are Research Expenditure (% of GDP), Publication (number of scientific articles), GDP, Cacao (cacao bean consumption per capita), Wine (wine consumption per capita), and Milk (milk consumption per capita). The numbers in the lower boxes indicate the Pearson's correlation coefficients; all the coefficients are significant (p<0.001).

