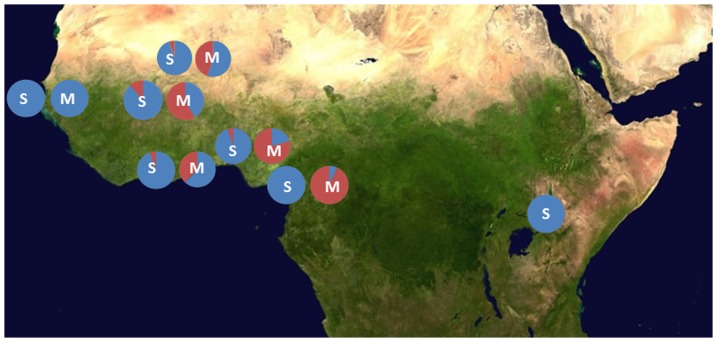
Figure 5. Geographical variation in frequency of Gste2-I114T in the S and M molecular forms of An. gambiae across Africa.
Blue represents the I114 and red the T114 frequency. The molecular form of the collection is indicated by the letter overlaid on each chart. Samples were from: Benin S-form n = 111; M-form n = 223. Burkina Faso S-form n = 115; M-form n = 216. Cameroon S-form n = 55; M-form n = 652. Ghana S-form n = 29; M-form n = 758. Guinea-Bissau S-form n = 38; M-form n = 39. Mali S-form n = 31; M-form n = 26. Uganda S-form n = 207. The base map was obtained from http://en.wikipedia.org/wiki/File:Africa_satellite_orthographic.jpg and was created by NASA. Details of the locations are given in Table S3 in File S1.

