
Figure 6. Dynamic changes in neutrophil infiltration in the lung tissues of mice after H7N9 virus challenge.
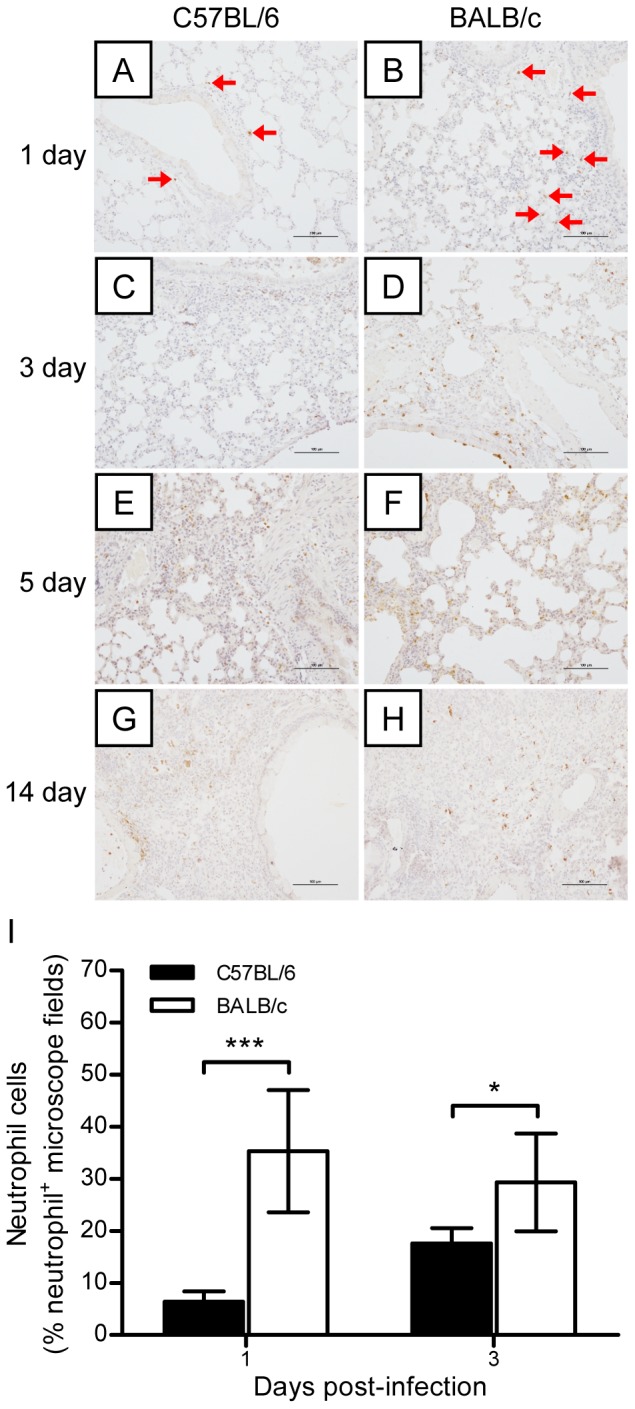
The experimental setup was the same as that described in Figure 2. (A–H) Immunohistochemical staining of neutrophils in the lungs of BALB/c and C57BL/6 mice on days 1, 3, 5, and 7 postviral infection. The red arrows indicate infiltrating neutrophils. (I) Semiquantitative assessments of neutrophil infiltration in the lungs on days 1 and 3 postviral infection (n = 6). The data are expressed as the mean ± SD (bar). * and *** indicate P<0.05 and 0.001, respectively.