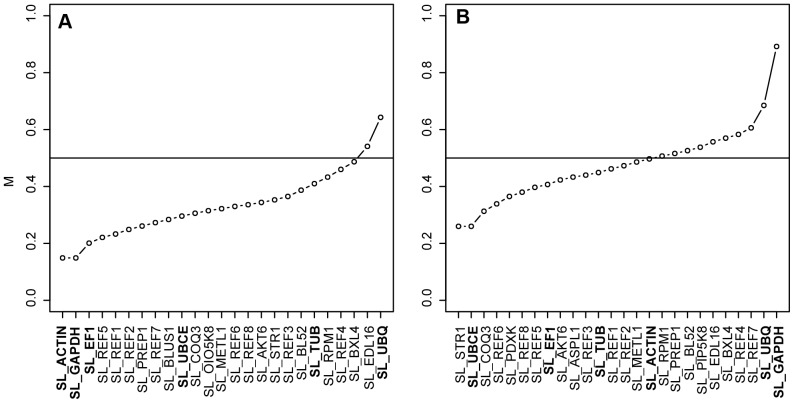
Figure 2. Gene expression stabilities of candidate reference genes.
Average expression stabilities (M) of the candidate reference genes in (A) flower buds (25 genes) and (B) leaves (26 genes) as estimated by geNorm. Small M values indicate high stability. M values for most genes were below 0.5, indicating high expression stability [36]. Traditional reference genes are indicated in bold.

