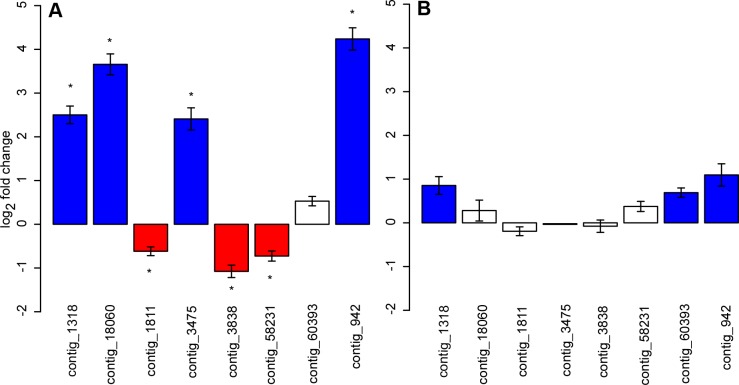
Figure 3. Sex-biased expression of eight target genes in vegetative and reproductive tissues.
Transcript levels are shown as log2 fold changes for eight sex-linked genes in (A) flower buds and (B) rosette leaves. Red and blue colours indicate female- and male-biased expression (fold change ≥1.5), respectively. Asterisks indicate significant expression differences between males and females based on Wilcoxon tests after correction for multiple testing. Error bars indicate mean standard errors calculated from five to seven biological replicates normalized over the three selected reference genes. No expression was observed for contig_3475 in leaf tissues.

