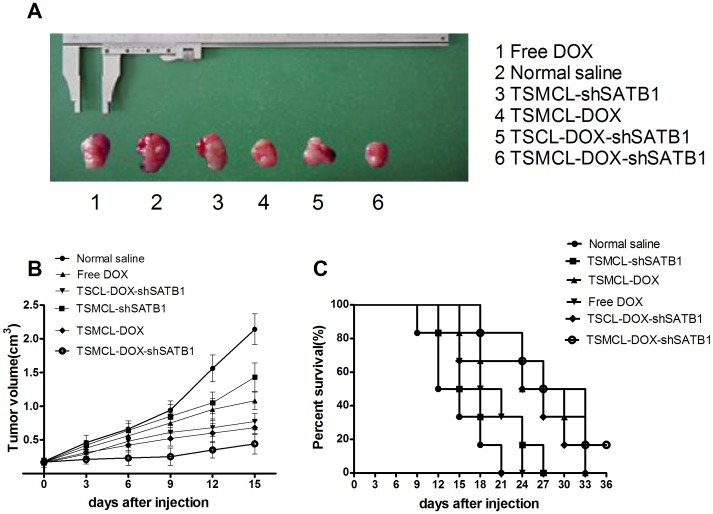
Figure 6. In vivo anti-tumor activity of different liposomes.
(A) Typical imaging of xenografted tumor. (B) Tumor size after treatment with Free DOX, TSMCL-DOX, TSMCL-shSATB1, TSCL-DOX-shSATB1, or TSMCL- DOX-shSATB1, treatment with normal saline was used as control. Data were presented as mean±SD (n = 6). (C) Survival curves of tumor bearing mice treated with Free DOX, TSMCL-DOX, TSMCL-shSATB1, TSCL-DOX-shSATB1, or TSMCL- DOX-shSATB1, treatment with normal saline was used as control.

