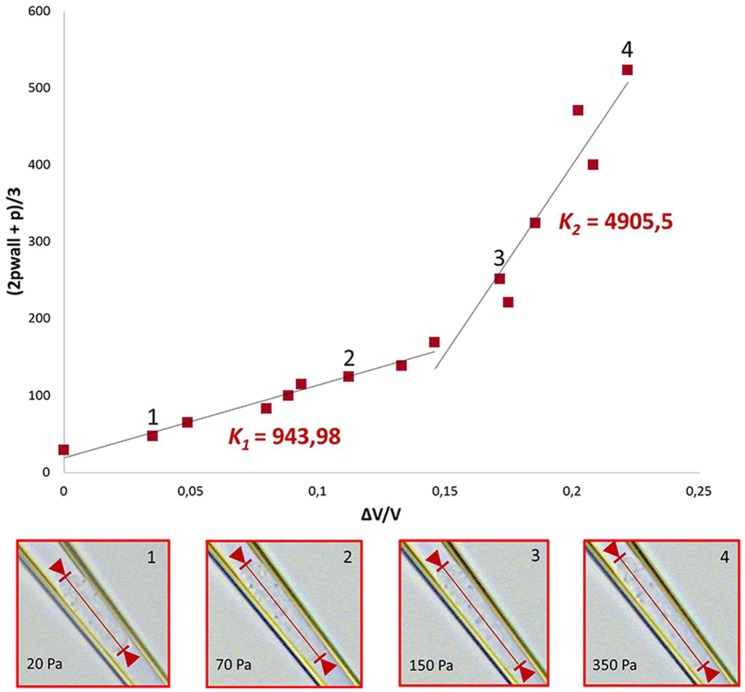
Figure 2. Calculation of modulus and deformation under pressure.
Since the mechanical properties of cells depend on the degree of deformation, the curves representing the compressive and the shear moduli were non-linear. For this reason, the moduli were calculated using two different linear fits in two different ranges of the deformation, shown in the top graph for the case of non-treated cells. These fits yield two significantly different values for the compressive modulus K (K1 and K2). The bottom four graphs display representative images showing cell deformation of a not-treated cell at room temperature, as the pressure increases (20, 70, 150, 350 Pa). The corresponding locations in the stress-strain are indicated as numbers in the main top graph.

