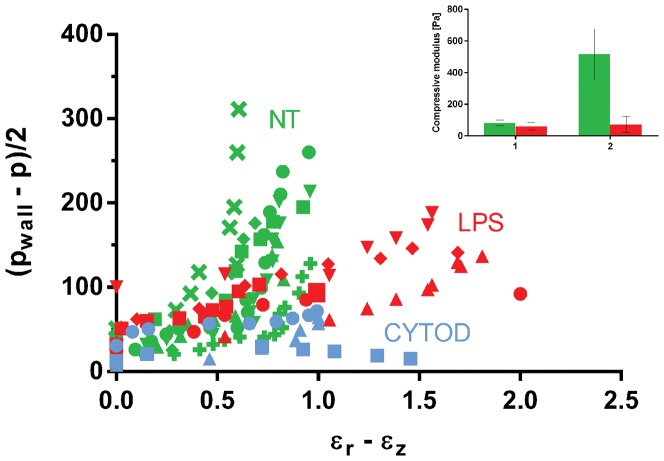
Figure 4. Shear modulus.
Scatterplot of the characteristic differential stress (pwall – p)/2 as a function of strain εr – εz for not-treated (GREEN), activated LPS-treated (RED) and cytoD-treated (BLUE) cells. In the insert of the figure, the quantification of the shear modulus for not-treated (cell n = 7) and activated cells (cell n = 5) is shown. The shear modulus was calculated by two linear fits, as shown in Fig.2.

