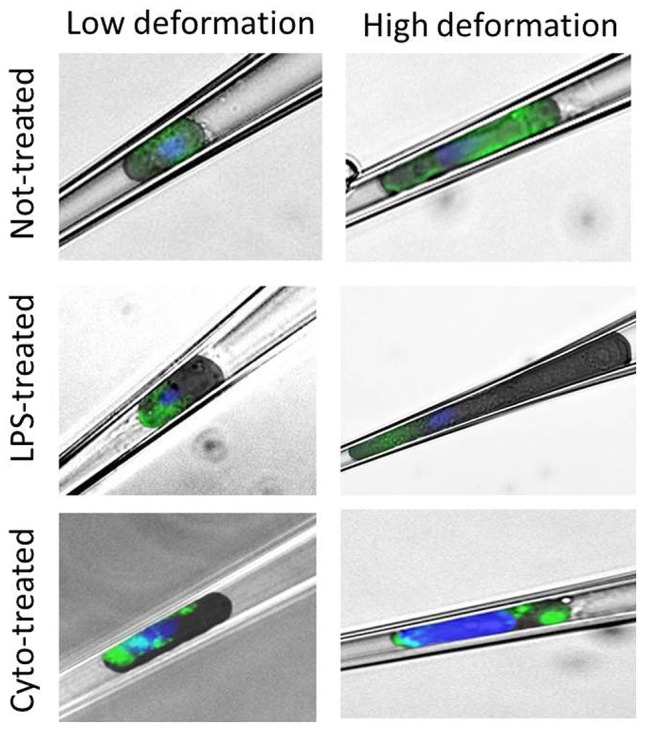
Figure 6. Actin staining in pipette.

Immunostaining of cells deformed in the micropipette. Deformation at 20 Pa (left) and at 350 Pa (right) are shown for each cell group. The images were obtained by overlay of a bright field image and a fluorescent image. Actin structure is stained in green. Nuclei are stained in blue.
