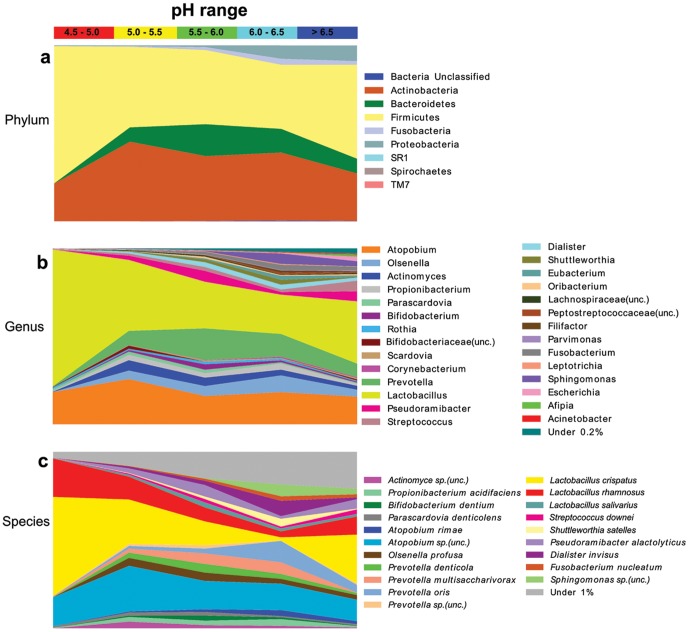
Figure 3. pH gradient and relative abundance at phylum, genus and species level.
Relative abundance of phyla (a) genera (b) and species (c) across the pH gradient in carious lesions was calculated from samples that each contained 1000 sequences and only included OTUs which occurred above five times. For full list of species level taxa see Table S3.

