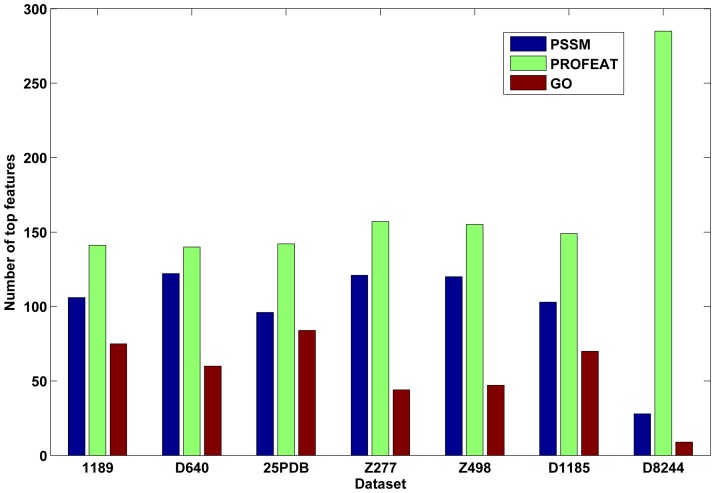
Figure 1. This graph shows the distribution of top322 features.
SVM-REF ranked the features according to their ability to separate different categories for each dataset. So the ranking lists and top features are different for different datasets. Apparently, proportions of different kinds of features are consistent for all seven datasets, i.e., physical-chemical properties reflected by PROFEAT constitute the majority group, followed subsequently by PSSM and GO annotation features. The bar chart shows the numbers of three different kinds of features in top features for each dataset.

