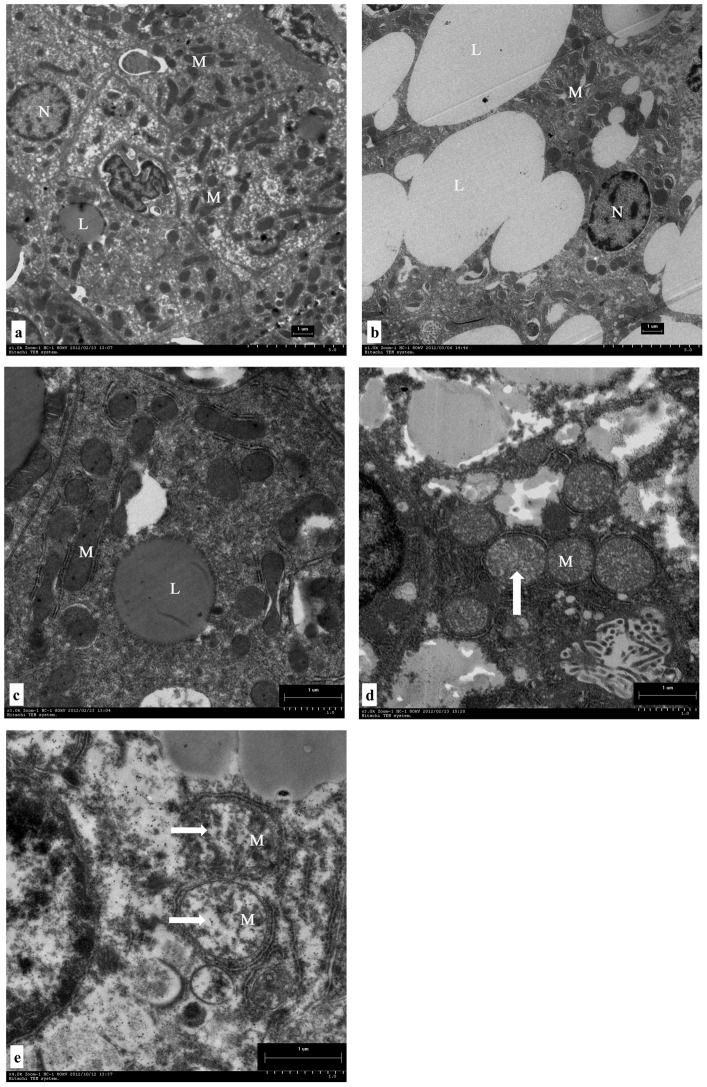
Figure 1. Transmission electron microscope images of blunt snout bream hepatocyte and mitochondrion ultrastructure: N (Nucleus), L (lipid droplet), M (mitochondrion).
Photomicrographs and main findings: (a) hepatocytes of fish fed low-fat diet with normal structure; (b) hepatocytes presenting extensive intracellular lipid droplets of fish fed high-fat diet; (c) hepatocytes of fish fed low-fat diet displaying dark and slender mitochondria; (d, e) mitochondria showing highly hydropic changes (↑, →) of fish fed high-fat diet. Bar = 1 μm.

