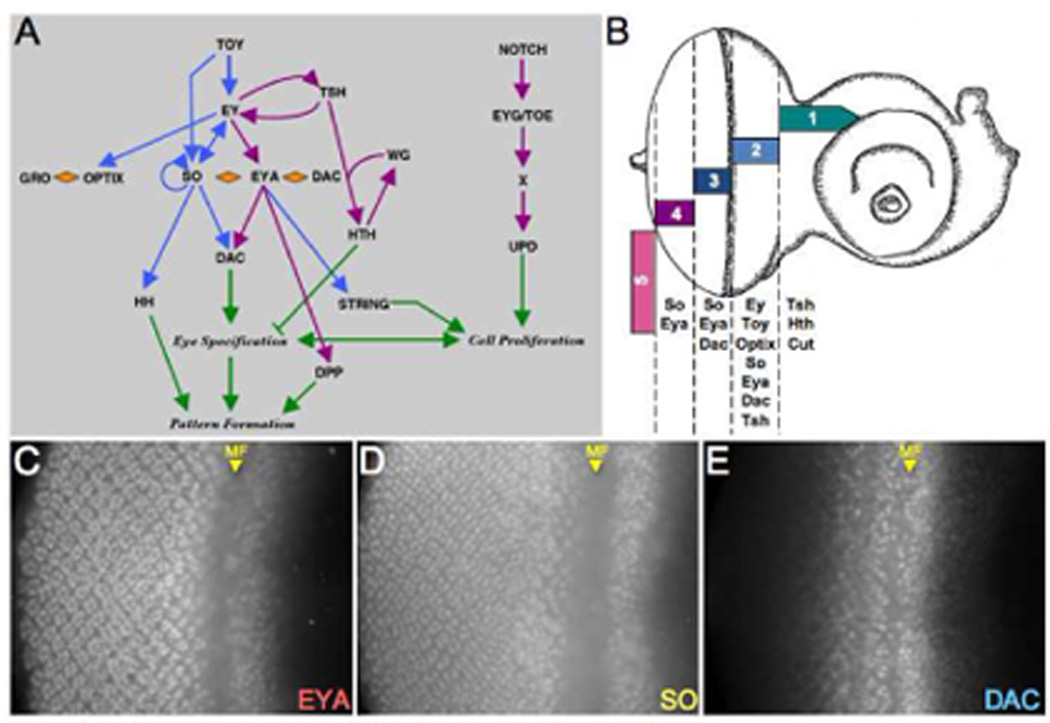
Figure 1. Spatial and Temporal Expression of the RD Network in the Fly Eye.

(A) Schematic diagram of the retinal determination network. (B) Schematic drawing of a third instar eye-antennal imaginal disc. The expression zones are modeled after the data presented in Bessa et al., 2002. (C–E) Immunofluorescence images of wild type eye discs. Immunostained proteins are at listed at the bottom right of each panel. MF = morphogenetic furrow. Anterior is to the right.
