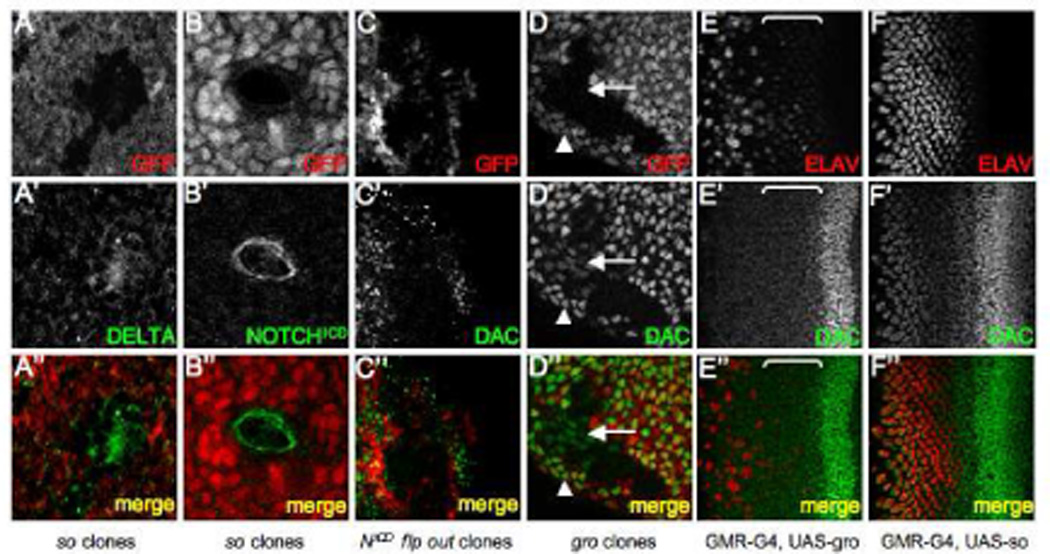
Figure 5. so Mutant Tissue Signals to Surrounding Cells via the Notch Pathway.

(A–D) Immunofluorescence images of eye discs containing so3 mutant, NICD flp-out, or gro mutant clones. All clones are positioned in zone 4. GFP is labeled in red. Immunostained proteins are in green. (E–F) Immunofluorescence images of eye discs in which GRO or SO is expressed behind the morphogenetic furrow via a GMR-GAL4 driver. ELAV is labeled red and DAC is green. The brackets in panels E indicate zone 3. Genotypes are listed at the bottom of each column. Anterior is to the right.
