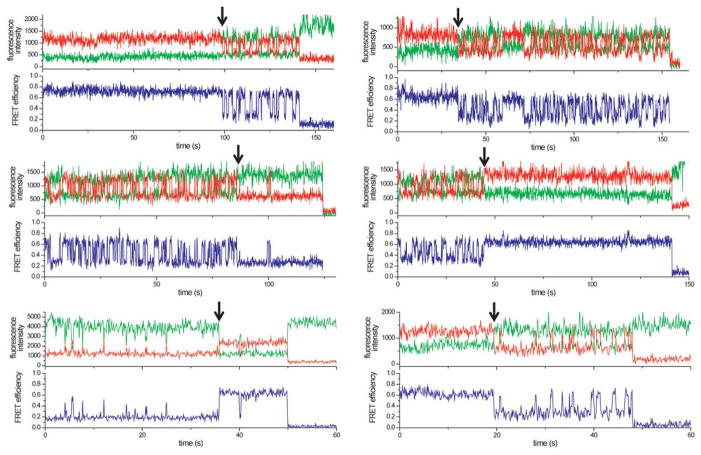
Extended Data Figure 9. Examples of switching between different h16-h3 dynamics.
Arrows indicate when the fluctuation dynamics switches between stable high FRET, stable low FRET, and alternating high and low FRET behaviors. The RNA was labeled as in Extended Data Figure 8.

