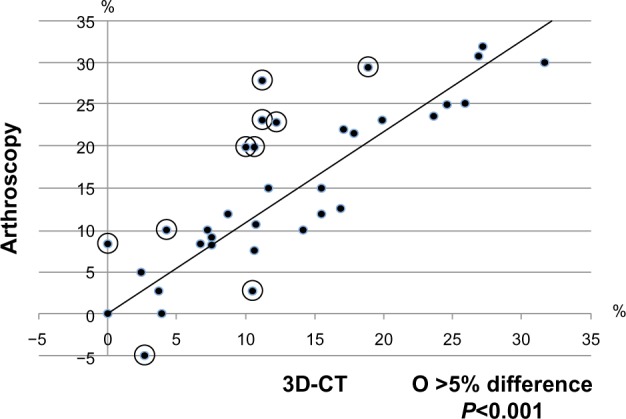
Figure 4.

Correlation of percentage glenoid bone loss as calculated by preoperative three-dimensional computed tomography (3D-CT) versus arthroscopic measurements. A circle indicates a glenoid with more than 5% difference between the 3D-CT and arthroscopic measurements.
