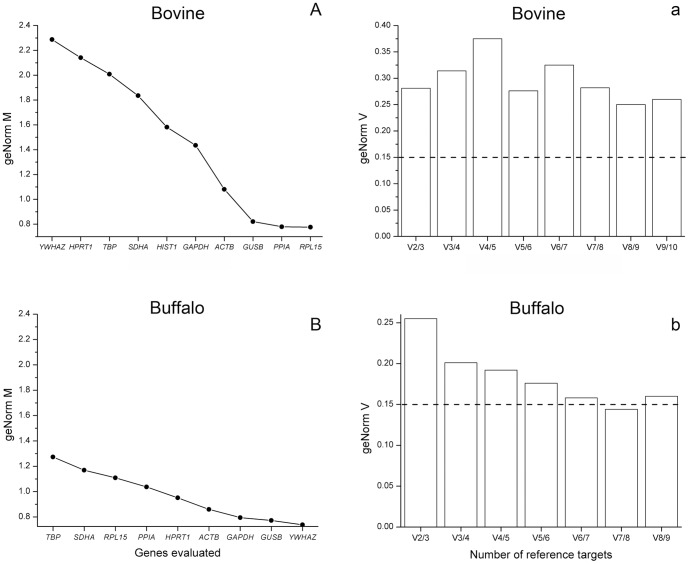
Figure 2. Gene expression stability of the candidate reference genes analyzed by the geNorm application.
Average expression stability values (geNorm M) of evaluated genes in bovine (A) and buffalo (B) oocytes, plotted from least stable (left) to most stable (right). Pairwise variation analysis (geNorm V), regarding bovine (a) and buffalo (b) oocytes, between the normalization factor NFn and NFn+1, to determine the optimal number of reference genes for normalization. In (a) and (b), the optimal number of reference genes is indicated by values of geNorm V below 0.15 (indicated by the dotted line). In (A), HIST1 means HIST1H2AG.

