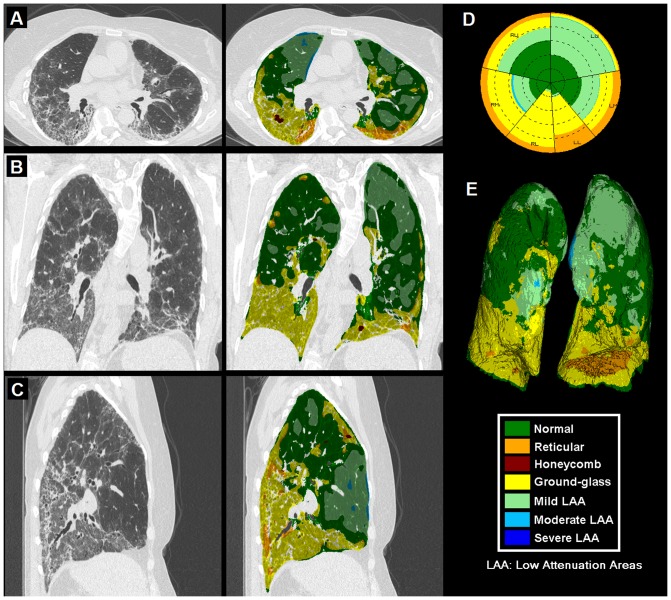
Figure 1. Representative CT lung volume characterized into parenchymal patterns by Computer Aided Lung Informatics for Pathology Evaluation and Rating (CALIPER).
It illustrates colored overlay in axial (A), coronal (B) and sagittal (C) sections with glyph (D) and 3D rendering (E). The color key for the seven patterns is also shown.

