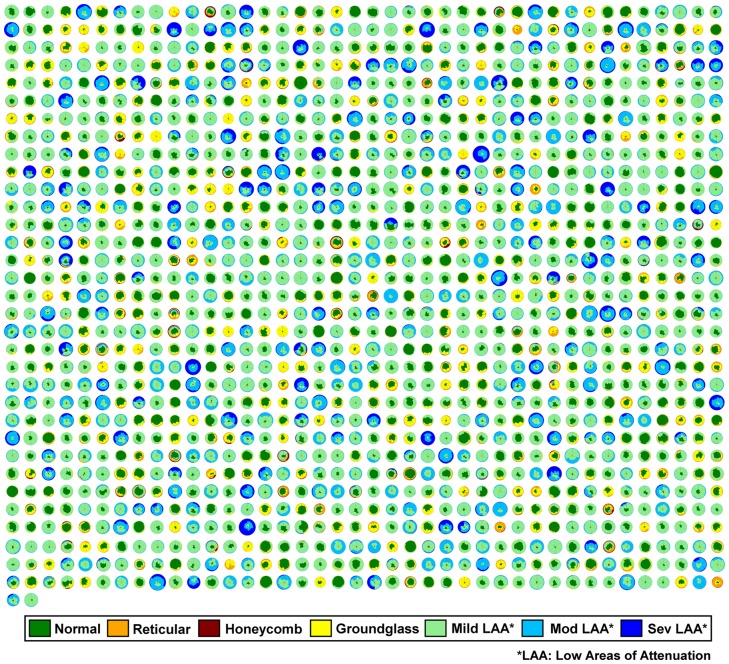
Figure 2. 1322 LTRC patients represented as glyphs.
The classified parenchymal patterns are represented in the indicated colors. The radius of the glyphs is proportional to the lung volumes; the COPD cases with extensive low attenuation areas likely due to emphysema are visually larger than more normal or fibrotic cases with considerable regions of reticular or honeycombing.

