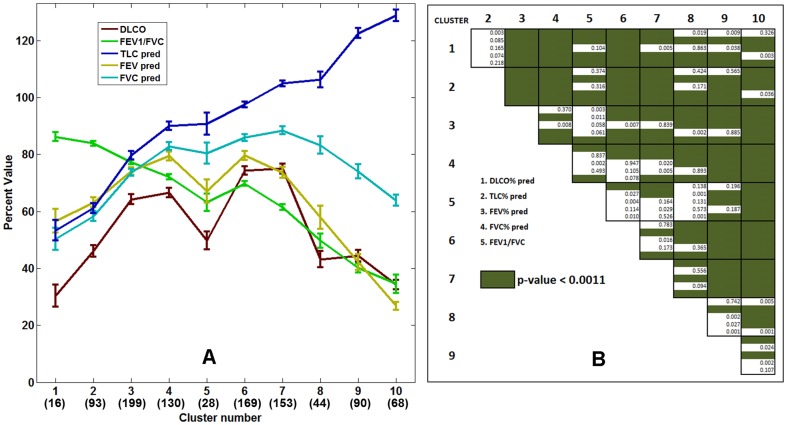
Figure 6. The cluster-specific mean physiologic measures (FEV1/FVC ratio, percentage predicted values of DLCO, TLC, FEV1, and FVC) for the ten stratified groups.
The error bars indicate the standard errors of mean. The numbers within parenthesis in the horizontal axis represent the number of cluster-specific cases used in the mean, standard error computation. The post-ANOVA pairwise t-test for the indicated five variables is shown as the staircase diagram with green fill for significant differences after Bonferroni correction. At least one variable is statistically significant across the clusters except for between groups (1, 2) and (5, 8).

