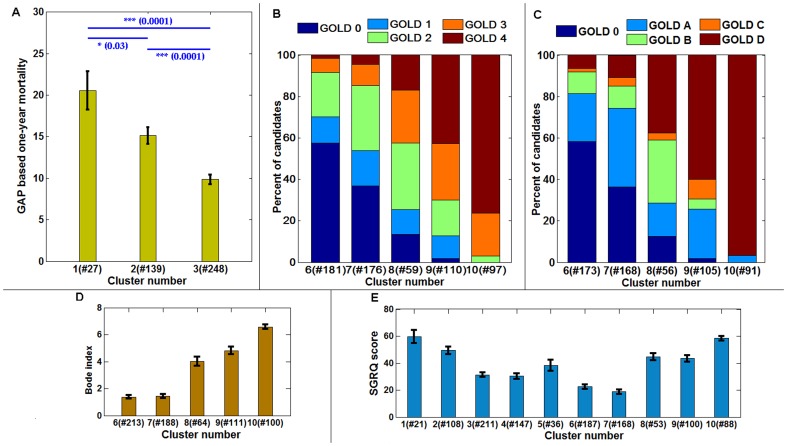
Figure 7. The correspondence of fibrotic and obstructive clusters with established indices and disease classification.
The Gender, Age and Physiology (GAP) based one-year mortality predictions for clusters 1, 2 and 3 in Figure 3 (A). The distribution of the old GOLD category (B) and new GOLD category (C) distribution across the obstructive clusters: 6, 7, 8, 9 and 10. The mean distribution of BODE indices across the obstructive clusters (D) and, the mean score distribution of SGRQ patient questionnaire scores of patients across all the clusters (E). The number of samples available in each cluster is noted in the horizontal axis. The error bars indicate the standard error of mean.

