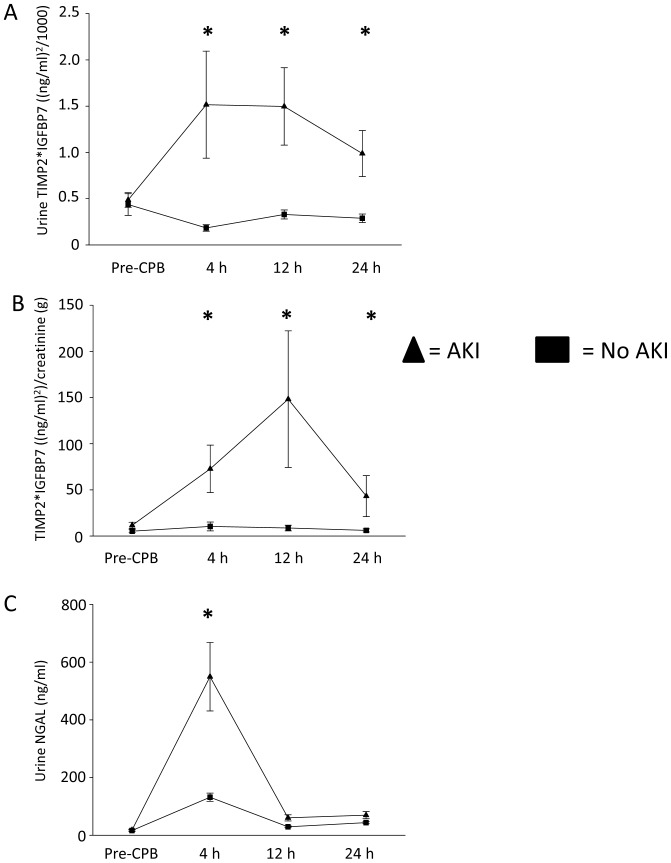
Figure 2. Analysis of urine [TIMP-2]*[IGFBP7].
(A) Graph shows mean urine [TIMP-2]*[IGFBP7] concentrations at various time points before and after cardiopulmonary bypass. (B) Graph shows urine [TIMP-2]*[IGFBP7] corrected for urine creatinine excretion. (C) Graph shows mean urine NGAL concentrations at various time points before and after cardiopulmonary bypass. Error bars are SE. Asterisks (*) denote significant differences (p≤0.05) between groups (AKI, non-AKI) at the respective time point.

