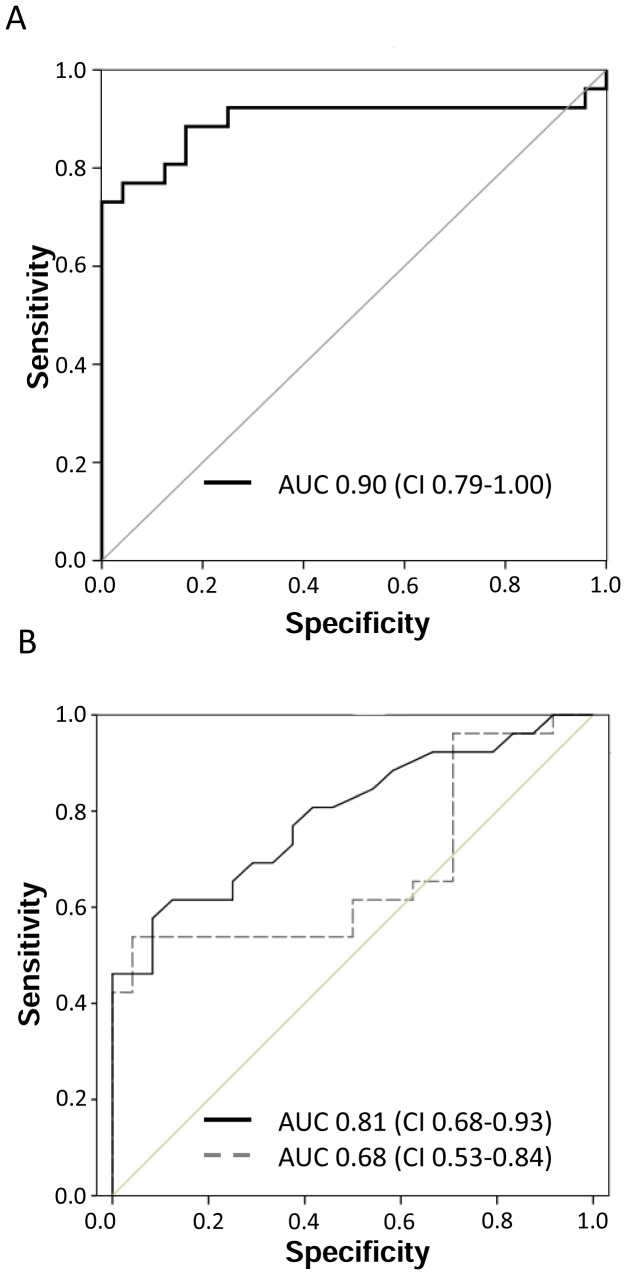
Figure 3. ROC curves for the maximum early composite and the 4.
(A) This figure displays the receiver operating characteristic (ROC) curve for the maximum early composite (maximum value from the first 24 postoperative hours) for [TIMP-2]*[IGFBP7]. (B) This figure displays the receiver operating characteristic (ROC) curves for the 4 h values of [TIMP-2]*[IGFBP7] (black solid line) and NGAL (gray dashed line).

