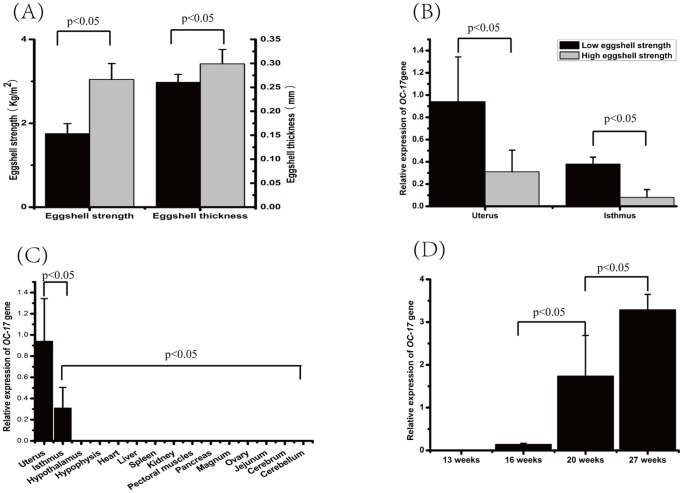
Figure 3. Eggshell biomechanical measurements and expression analysis of Ovocleidin-17.
(A) Eggshell phenotypes showed significant differences between the two tails of the eggshell strength groups; (B) the OC-17 mRNA expression levels were significantly higher in hen uterus and isthmus in the low eggshell strength groups compared with the high eggshell strength groups; (C) OC-17 mRNA can only be detected in hen uterus and isthmus among the 15 sampled adult hen tissues. One way ANOVA analysis suggested there were significant expression differences among different tissues. OC-17 showed a much higher expression level in uterus than in other tissues (pairwise t-test, P value<0.05); (D) One way ANOVA analysis suggested that significant expression differences existed among different stages. OC-17 showed an increasing pattern of expression between the immature and mature laying stages (pairwise t-test, P value<0.05).

