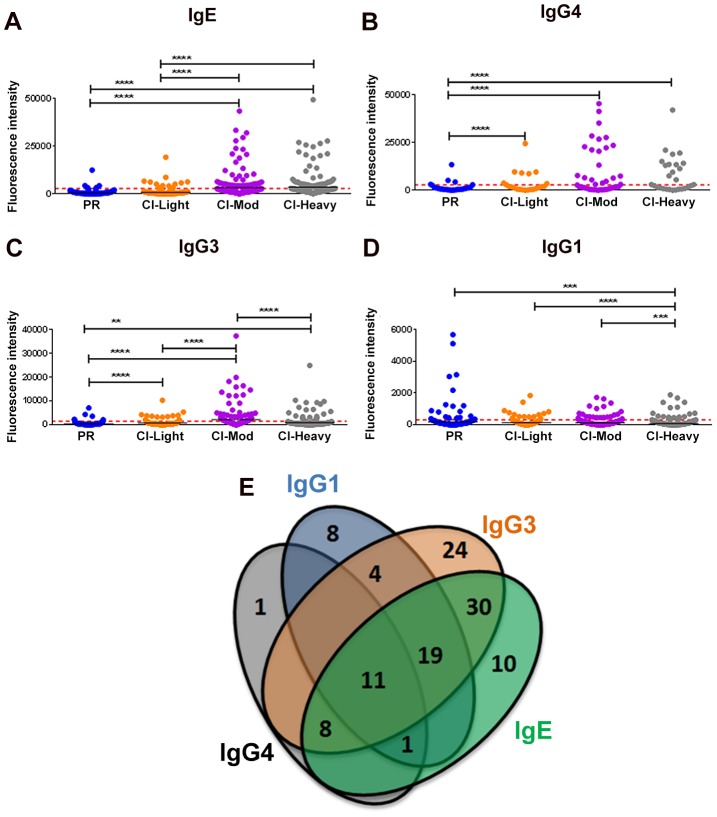
Figure 1. Isotype and subclass-specific antibody recognition profiles of PR and CI individuals to schistosome antigens printed on the proteome microarray.
The average adjusted signal intensity for IgE (A), IgG4 (B), IgG3 (C) and IgG1 (D) antibody responses of individual protein microarray features Cohorts of individuals that are putatively resistant (PR) to S. mansoni infection, or have low (CI-Light), moderate (CI-Mod) and heavy (CI-Heavy) intensity infections (based on eggs per gram of feces) were graphed. Red lines denote the cut-offs for each antibody isotype/subclass calculated by determining the average of the signal intensity for control spots on the microarray that contained no DNA (No DNA controls). Statistical analysis was performed using one-way ANOVA with Dunn's multiple comparisons test. *p<0.05; **p<0.01, ***p<0.001, ****p<0.0001. Venn diagrams (E) representing the combined data of Figures 1A-D. Values in the diagram show the protein microarray features recognized by each isotype/subclass.

