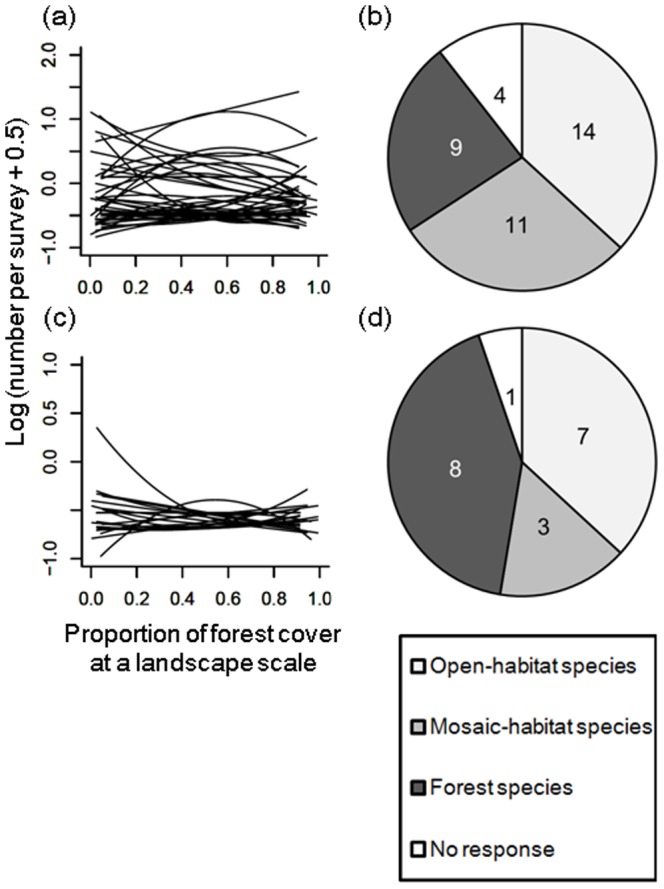
Figure 3. Response of each species to proportion of forest cover at a landscape scale.

(a, c) Relationships between abundance of each species and proportion of forest cover at a landscape scale and (b, d) pie charts showing the proportions of species with the four categories of response type (open-habitat species, mosaic-habitat species, forest species, and no response) among (a, b) 38 wide-ranging species, and (c, d) 19 narrow-ranging species. Regression lines for each species were calculated in the same way as those for species richness (see explanation in the caption to Figure 2). Criteria for categorization of each species according to the proportion of forest cover are given in the text.
