
Figure 5.
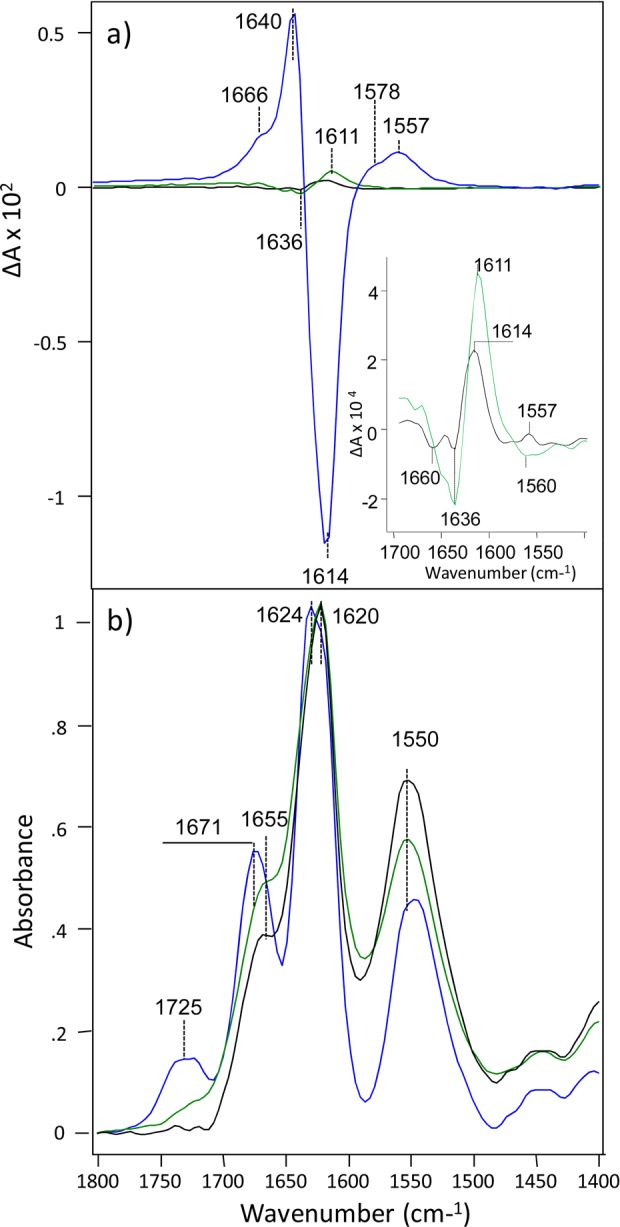
VCD (a) and IR (b) spectra of HET-s (218–289) fibrils grown at pH 2.0 (blue), 3.3 (green), and 3.9 (black) for 2 months at room temperature. For better visualization of band positions and intensities the insert shows VCD spectra of only pH 3.3 (green) and pH 3.9 (black) fibrils.