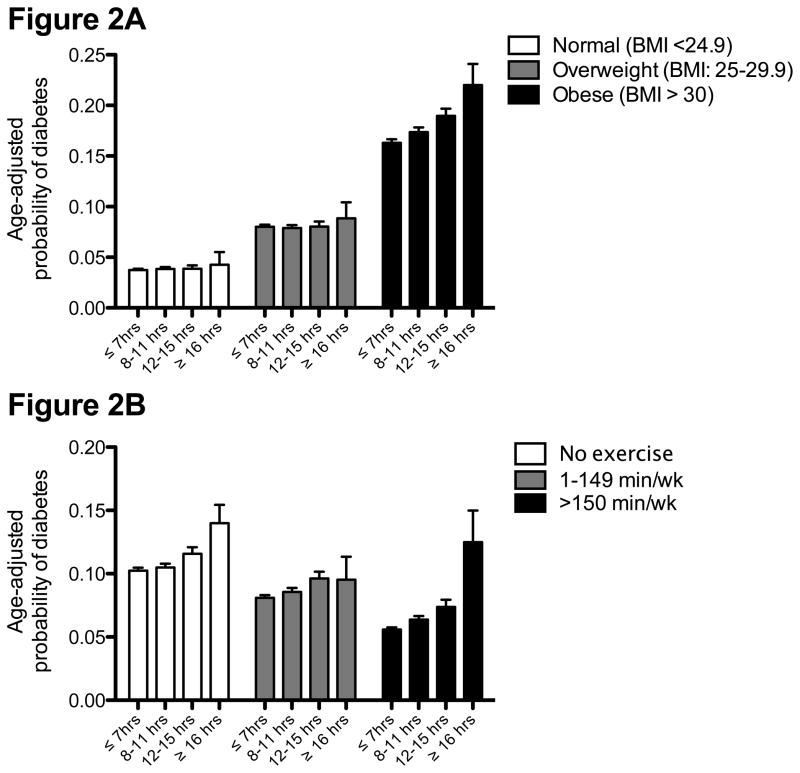
Figure 2.
Age-adjusted probability of diabetes according to hours of sitting stratified across categories of (A) body mass index (p-value for trend: BMI < 24.9 kg/m2: 0.537; BMI 25–29.9 kg/m2: 0.945; BMI>30 kg/m2: <0.001); (B) minutes performing moderate to vigorous intensity physical activity (all p-values for trend <0.01).

