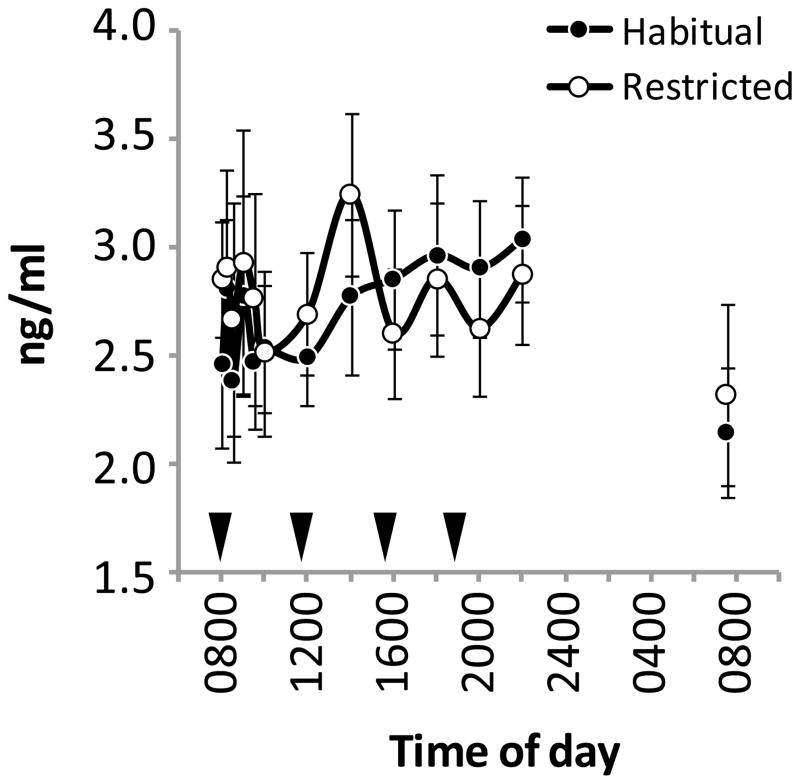
Figure 2.
Plasma adropin concentrations on day 4 of the inpatient study. Plasma adropin concentrations were measured in samples collected serially over a twenty-four hour period. These samples were from females subjected to restricted sleep or allowed to adhere to normal (habitual) sleep patterns. The black triangles indicate meal times (breakfast at 0800, lunch at 1200, afternoon snack at 1600, and dinner and 1800 h).

