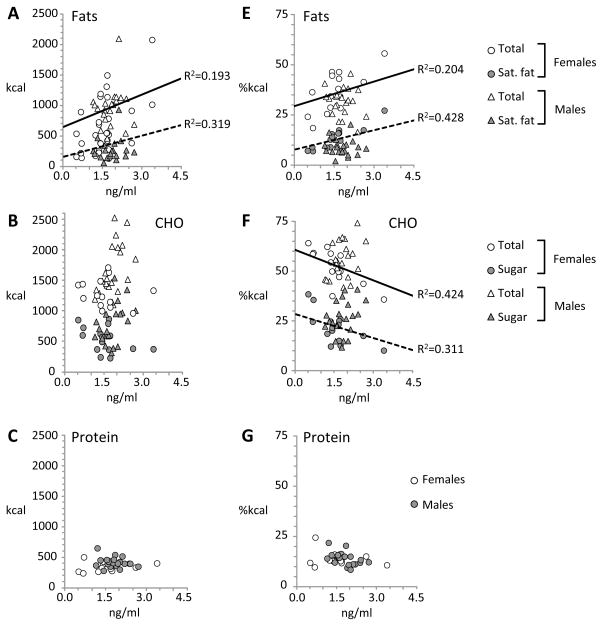
Figure 4.
Scatterplots showing correlations between fasting plasma adropin concentrations on day 6 (Post-FS) with day 5 intakes of fat (A,E), carbohydrate (CHO) (B,F) and protein (C, G) as calories (A–C) or percent of total energy (E–G). Food intake data was collected on day 5 in habitual or sleep restricted conditions.

