
Figure 3. Stochasticity of elongation kinetics.
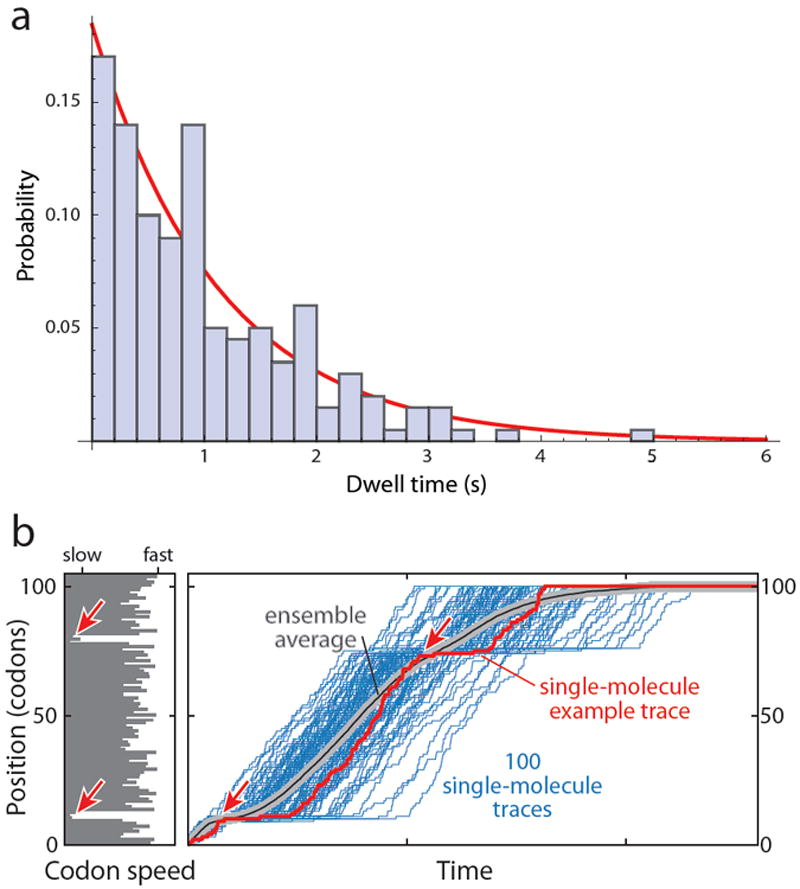
a. Histogram of the probability density of a simulated exponential distribution of 200 dwell times calculated for a mean dwell time of 1.0 s. The probability density is the fraction of dwell times in each bin divided by the width of the bin, here 0.2 s. The calculated mean was 1.03 s and the mean from the exponential fit (red line) was 1.08 s. The distribution exhibits a large range of dwell times around the mean, ranging from less than 0.2 s to 5 s. b. Loss of synchronicity in an ensemble. The left panel shows the codon speed profile of a hypothetical mRNA in the form of a bar diagram: The length of each bar represents the mean dwell time at each codon, which could be determined by the abundance of the cognate tRNA as well as the sequence context. The red arrows highlight two regions of slowly translated codons with long dwell times. The right panel displays simulated traces (blue) that would result from the observation of 100 individual ribosomes stepping along this mRNA (with one trace highlighted in red). Long pauses are observed in the region of slowly translated codons (red arrows). However, because each dwell time is drawn from an exponential distribution around the mean dwell time at the respective codon, synchronicity among the 100 ribosomes is rapidly lost, and the pause around codon position 80 is not apparent in the ensemble average (grey/black line). Therefore, even if it was possible to perfectly synchronize and subsequently observe an ensemble of just 100 molecules, the differences in elongation rate along a given mRNA cannot be resolved. Single-molecule measurements provide this capability.