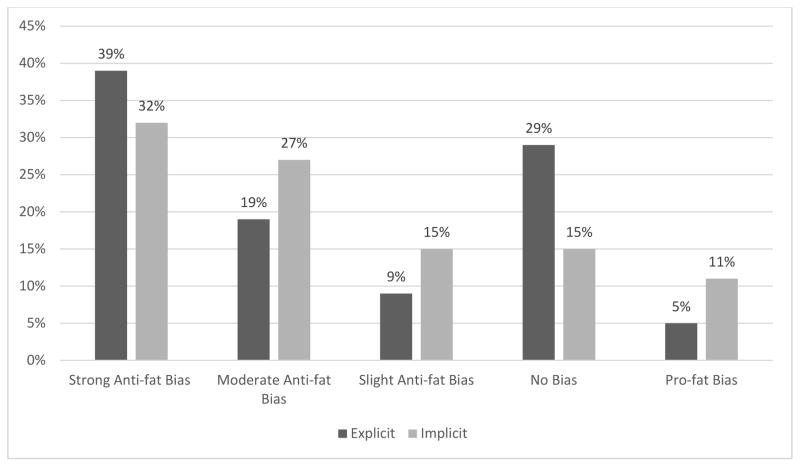
Figure 2. Distribution of explicit and implicit weight bias in a national sample of medical students.
An IAT score ≥ .65 was considered strong; a score < .65 and ≥ .35, moderate; and a score <.35 and ≥.15, slight anti-fat bias. A score > −.15 and <.15 was considered no bias, and a score ≤ −.15 was considered pro-fat bias. For explicit bias, a difference between feeling thermometer scores for Whites and obese people > 15 was considered strong; a difference between 6 and 15, moderate; and difference between 1 and 5, slight anti-fat bias. A difference of 0 was no bias, and a difference < 0 was pro-fat bias.

