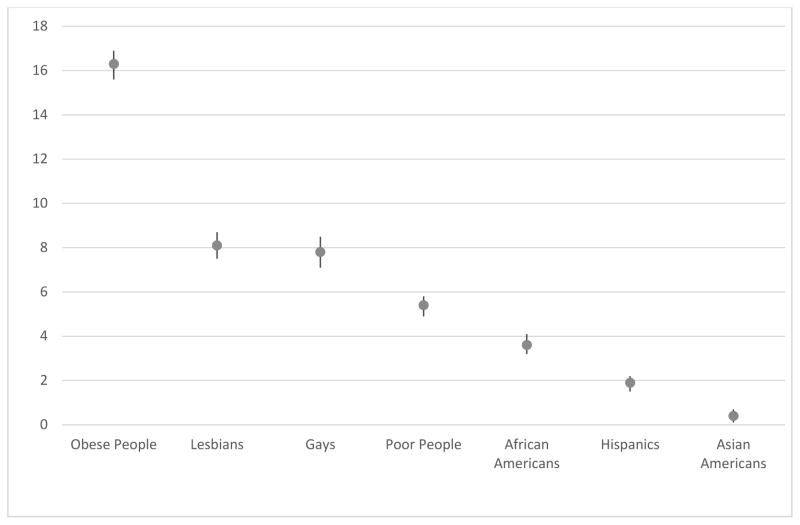
Figure 3. Explicit bias against people who are obese and other stigmatized/minority groups relative to Whites.
The dots represent the sample mean of each participant’s rating of whites minus their rating of obese people on feeling thermometers. Higher numbers indicate lower warmth toward the group relative to Whites. The bars represent the 95% confidence intervals

