
Figure 3.
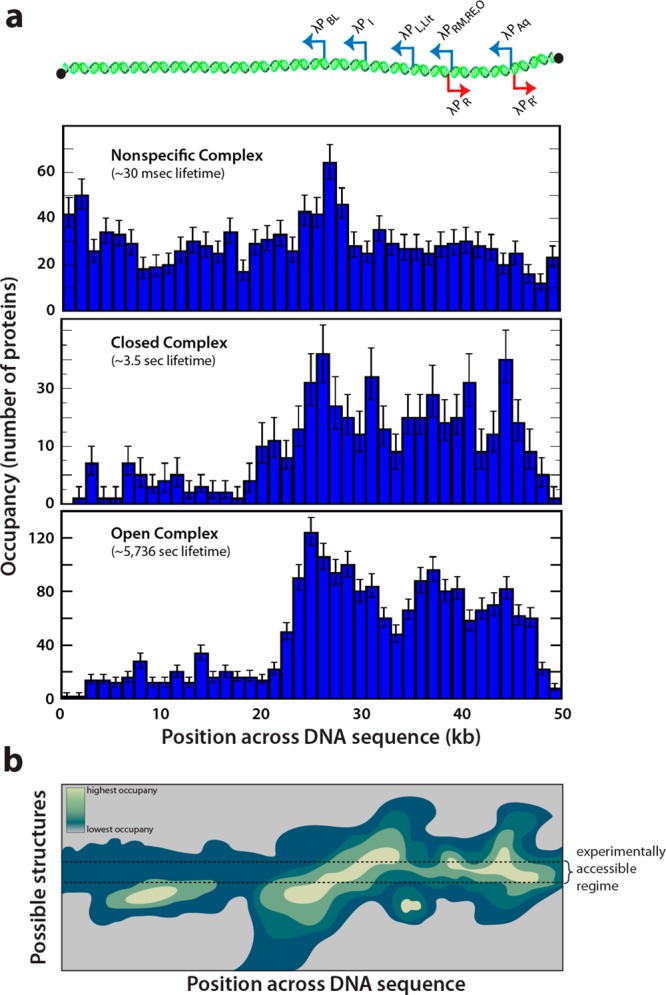
Promoter recognition by RNA polymerase. (a) Schematic overview of the promoter distribution in the lambda phage genome aligned with binding distributions of nonspecifically bound RNA polymerase (top), closed complexes (middle), and open complexes (bottom).37j Adapted with permission from ref (37j). (b) Schematic representation of a hypothetical 2D binding landscape across all particular DNA structural conformations available to a given DNA molecule including those brought about by different environmental settings and/or the presence of other DNA binding proteins. This schematic helps illustrate that in principle any given methodology used to probe a binding landscape can only access a relatively restricted region of potential structural space for a given DNA sequence.