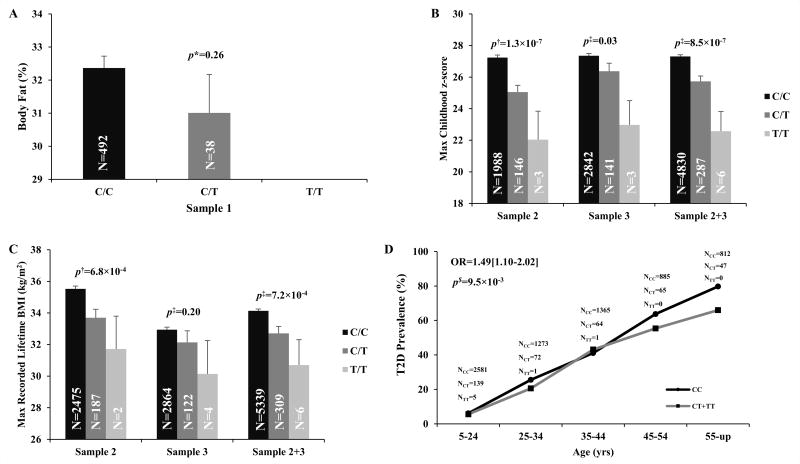
Figure 2. R151H, a novel low frequency variant in RNF10 has a non-significant trend for association with PFAT (A) and is associated with maximum childhood z-score (B), and maximum recorded BMI from a longitudinal exam when the subject was non-diabetic and ≥15 years of age (C) with the risk allele modestly increasing the risk for T2D (D).
PFAT: Percent body fat, maximum childhood z score is the highest age and sex adjusted z-score from an exam at age <20yrs. For presentation, the z-scores were sex and age (female, 12yr) standardized to a BMI scale. Maximum recorded BMI is defined as the highest BMI recorded from a longitudinal exam when the subject was non-diabetic and ≥15 years of age.* p values were adjusted for age, sex and nuclear family membership. $ p values were adjusted for age, sex, birth year, nuclear family membership and admixture estimates.‡ p values were adjusted for birth year, nuclear family membership and admixture estimates.

