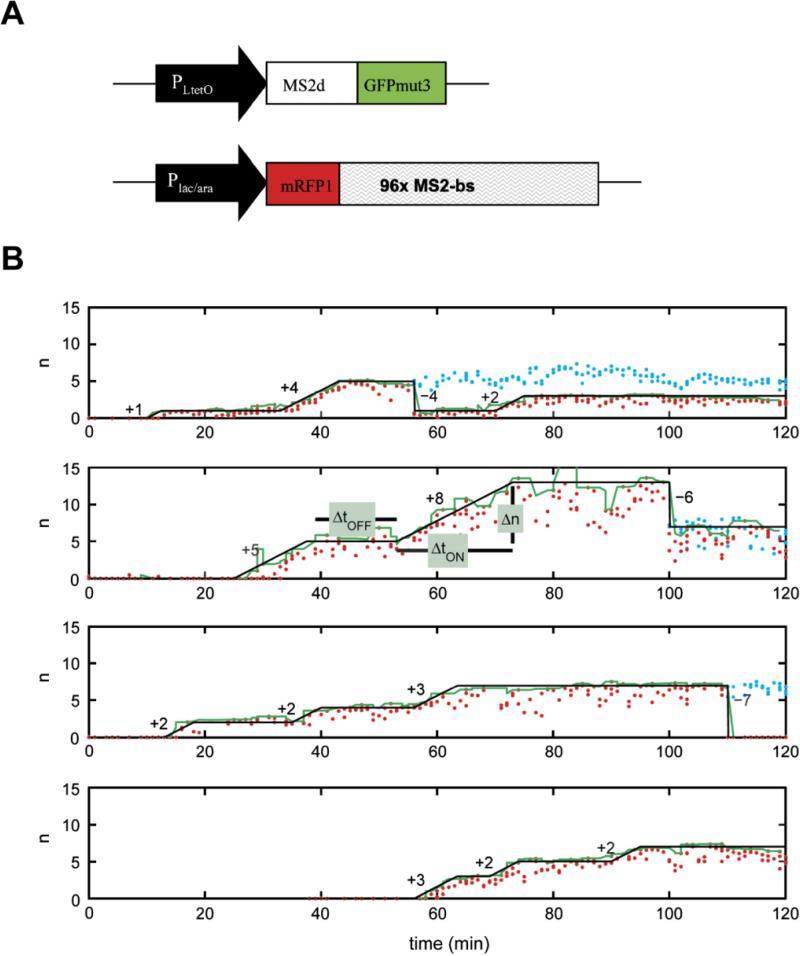
Figure 10. Transcriptional bursting as measured by mRNAs bound by MCP-GFP in individual E. coli cells.
(A) Schematic of MCP-GFP and mRFP constructs with 96xMS2 binding sites used in this study. (B) Plots from four cells depicting typical estimated numbers of transcripts (n) as a function of time. Red dots indicate raw data, the green line represents smoothed fit, and the black line depicts a linear function that shows periods of transcriptional activity and inactivity. Cyan dots represent the number of transcripts in the daughter cell after cell division. The numbers represent the change in the number of transcripts. Reprinted with permission from ref. 306. Copyright 2005 Elsevier.

