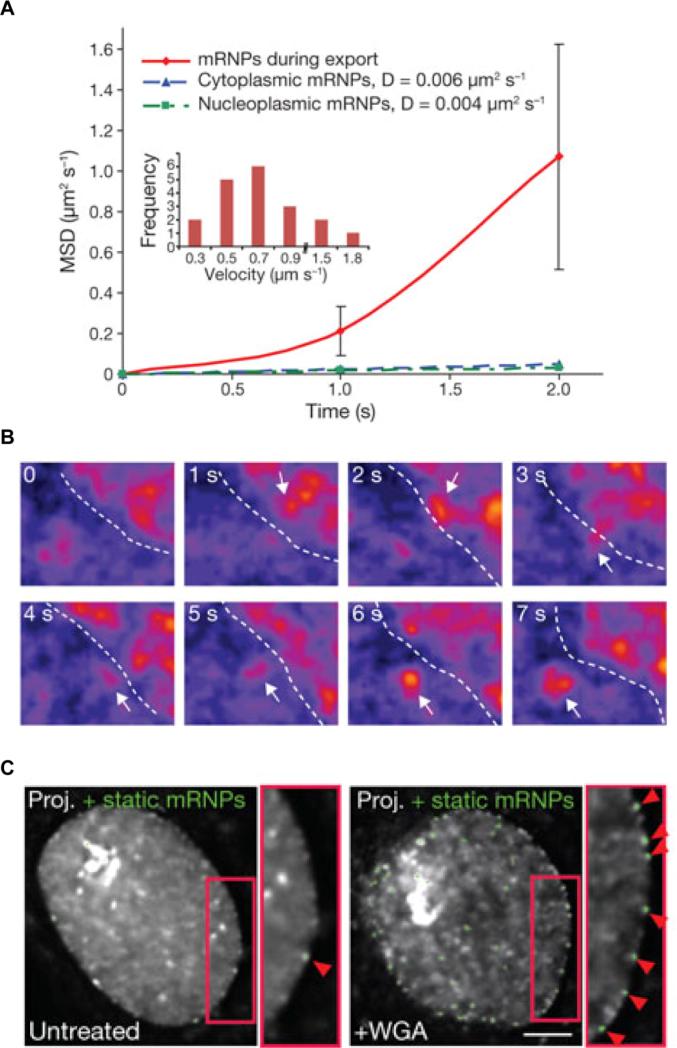
Figure 12. Nuclear export of MS2 labeled mRNA in mammalian cells.
(A) MSD plot comparison of the nuclear export (red) relative to cytoplasmic (blue) and nucleoplasmic (green) diffusion. (B) Pseudo-colored time-series of an mRNP (red), marked with a white arrow, during nucleocytoplasmic transport across the nuclear envelope (dotted white line). (C) Stalled (red arrows) MS2 labeled RNA (green) at the nuclear envelope before (left image) and after (right image) ATP depletion. Reprinted with permission from ref. 225. Copyright 2010 Nature Publishing Group.

